We are very pleased to present to you an overhaul of our user interface for the Medstack Dashboard and MedStack Control. While the user flow of the product is largely the same, we have also introduced a few new optimizations around managing Docker Services. We are also introducing two important new features: Allowed IPs to Managed Databases, and viewing of logs for destroyed Docker containers to improve debugging.
Our new UI
Under the hood we have implemented Tailwind UI, a masterfully-designed component library which has enabled us to dramatically speed up our UI development and improve the quality at the same time. Assessing tools, frameworks and libraries is a huge part of the work we all do as software developers, and we were thrilled to find and implement Tailwind as one of its first early-access implementers.
What will you see visually as a user?
- The top navigation bar is now on the left, giving us more space and more flexibility to enhance it over time.
- The widgets like buttons, tabs, and tables are more sophisticated and easier to use.
- Screens are now responsive so they are easier to use on mobile devices.
What won’t you see?
- Big changes to the flow. Most screens have the same layout and flow as before the update.
Some minor changes to the Cluster and Service screens
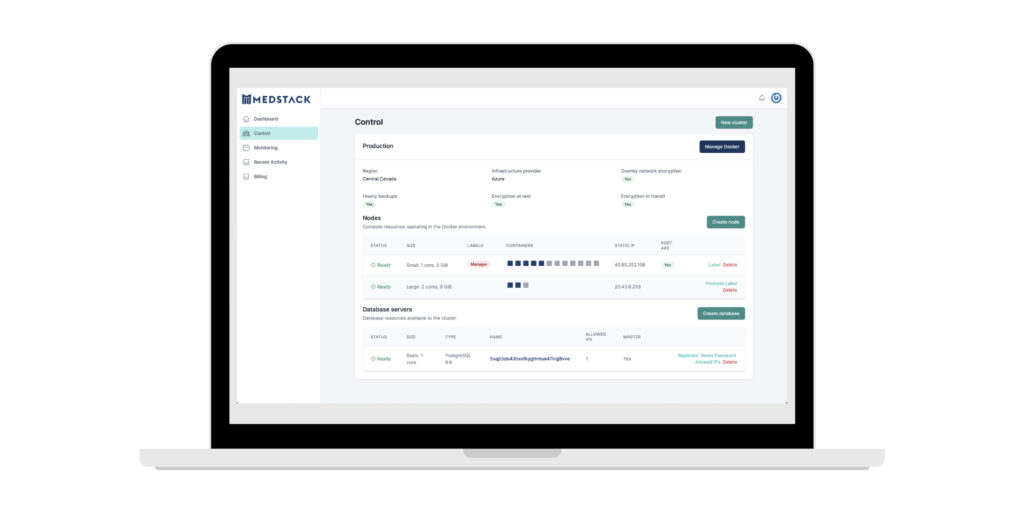
We also took this opportunity to make some small improvements to the Cluster and Service screens where MedStack Control users spend most of their time. We have deliberately kept these changes small at this point so that we don’t introduce too much disruption—rather, we will be continuously improving the user experience over time.
What minor flow changes are introduced?
- On the main MedStack Control screen showing your clusters, “Configure” is now “Manage Docker”, and we have added some data about the cluster.
- In the Node list, you can click on the status icon for a container to jump directly to that Service.
- When you view a Docker Service, the button to create a webhook has been moved to the “Image update webhooks” section
- Buttons and links to work with Nodes, Services, and Containers (e.g., Shell, Exec, Logs) have been moved from a dropdown to separate links.
Allowed IPs and stopped container logs
We are continuously improving our product, and so along with this UI update we are also introducing two new features:
- You can now directly access Managed Databases from specific Allowed IP addresses. We have documented this new capability in the article Managed external connections to managed database servers.
- Docker logs for stopped containers are accessible on the Services screen. See View Docker container logs.
As always, stay connected with us to learn about more improvements to MedStack Control as we introduce them, and please don’t hesitate to drop us a line to give us your thoughts and feedback.